European countries represented in the study
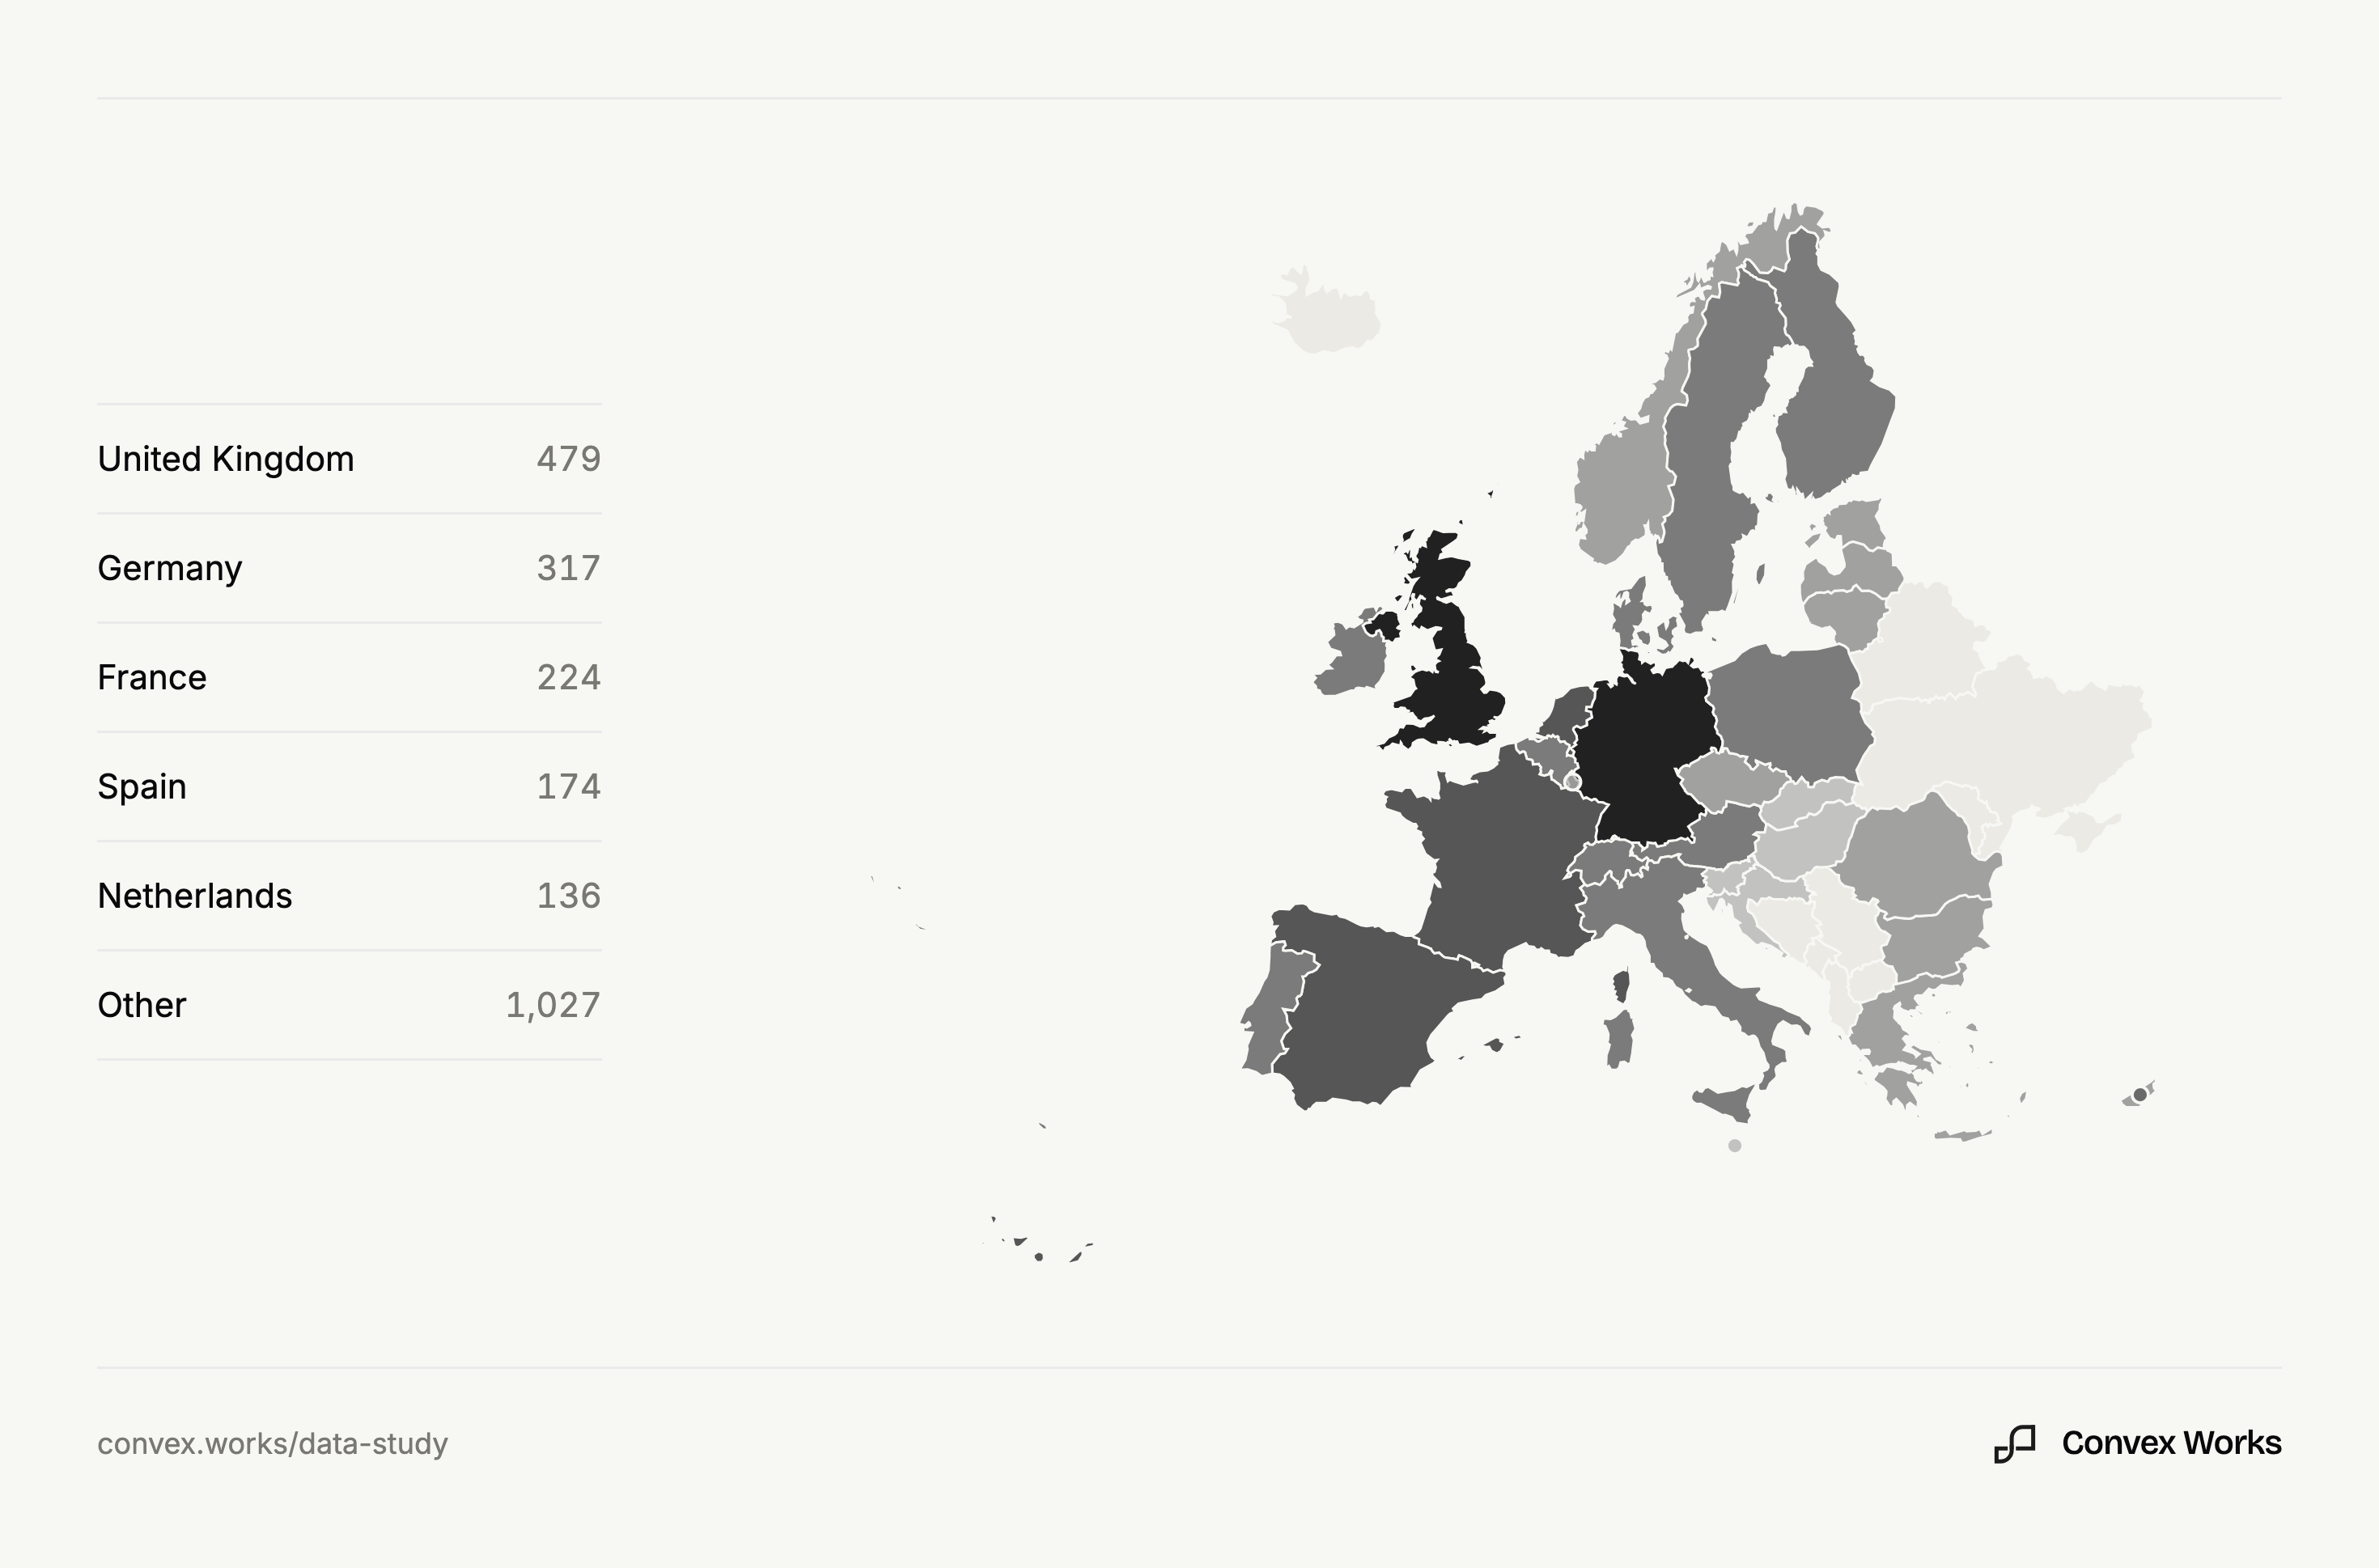
The data behind this chart
| Country | Companies |
|---|---|
| United Kingdom | 479 |
| Germany | 317 |
| France | 224 |
| Spain | 174 |
| Netherlands | 136 |
| Sweden | 86 |
| Italy | 85 |
| Austria | 71 |
| Switzerland | 63 |
| Belgium | 63 |
| Denmark | 61 |
| Poland | 55 |
| Finland | 54 |
| Ireland | 50 |
| Portugal | 50 |
| Norway | 44 |
| Estonia | 43 |
| Romania | 36 |
| Lithuania | 33 |
| Czechia | 29 |
| Bulgaria | 29 |
| Cyprus | 27 |
| Greece | 25 |
| Latvia | 25 |
| Hungary | 22 |
| Slovakia | 20 |
| Slovenia | 18 |
| Luxembourg | 18 |
| Croatia | 11 |
| Malta | 9 |
Cite this figure
This figure is published by Convex Works under a Creative Commons Attribution 4.0 licence. You may reuse it anywhere as long as you keep the attribution.
Plain text
Convex Works (2026). European countries represented in the study. European software data study. https://convex.works/research/b2b-eu-data-systems/figures/country-distribution
BibTeX
@misc{convexworks2026countrydistribution,
  author       = {{Convex Works}},
  title        = {European countries represented in the study},
  howpublished = {European software data study},
  year         = {2026},
  url          = {https://convex.works/research/b2b-eu-data-systems/figures/country-distribution}
}
Image file
Download PNG 980×646 at source scale