Data system score compared with estimated traffic
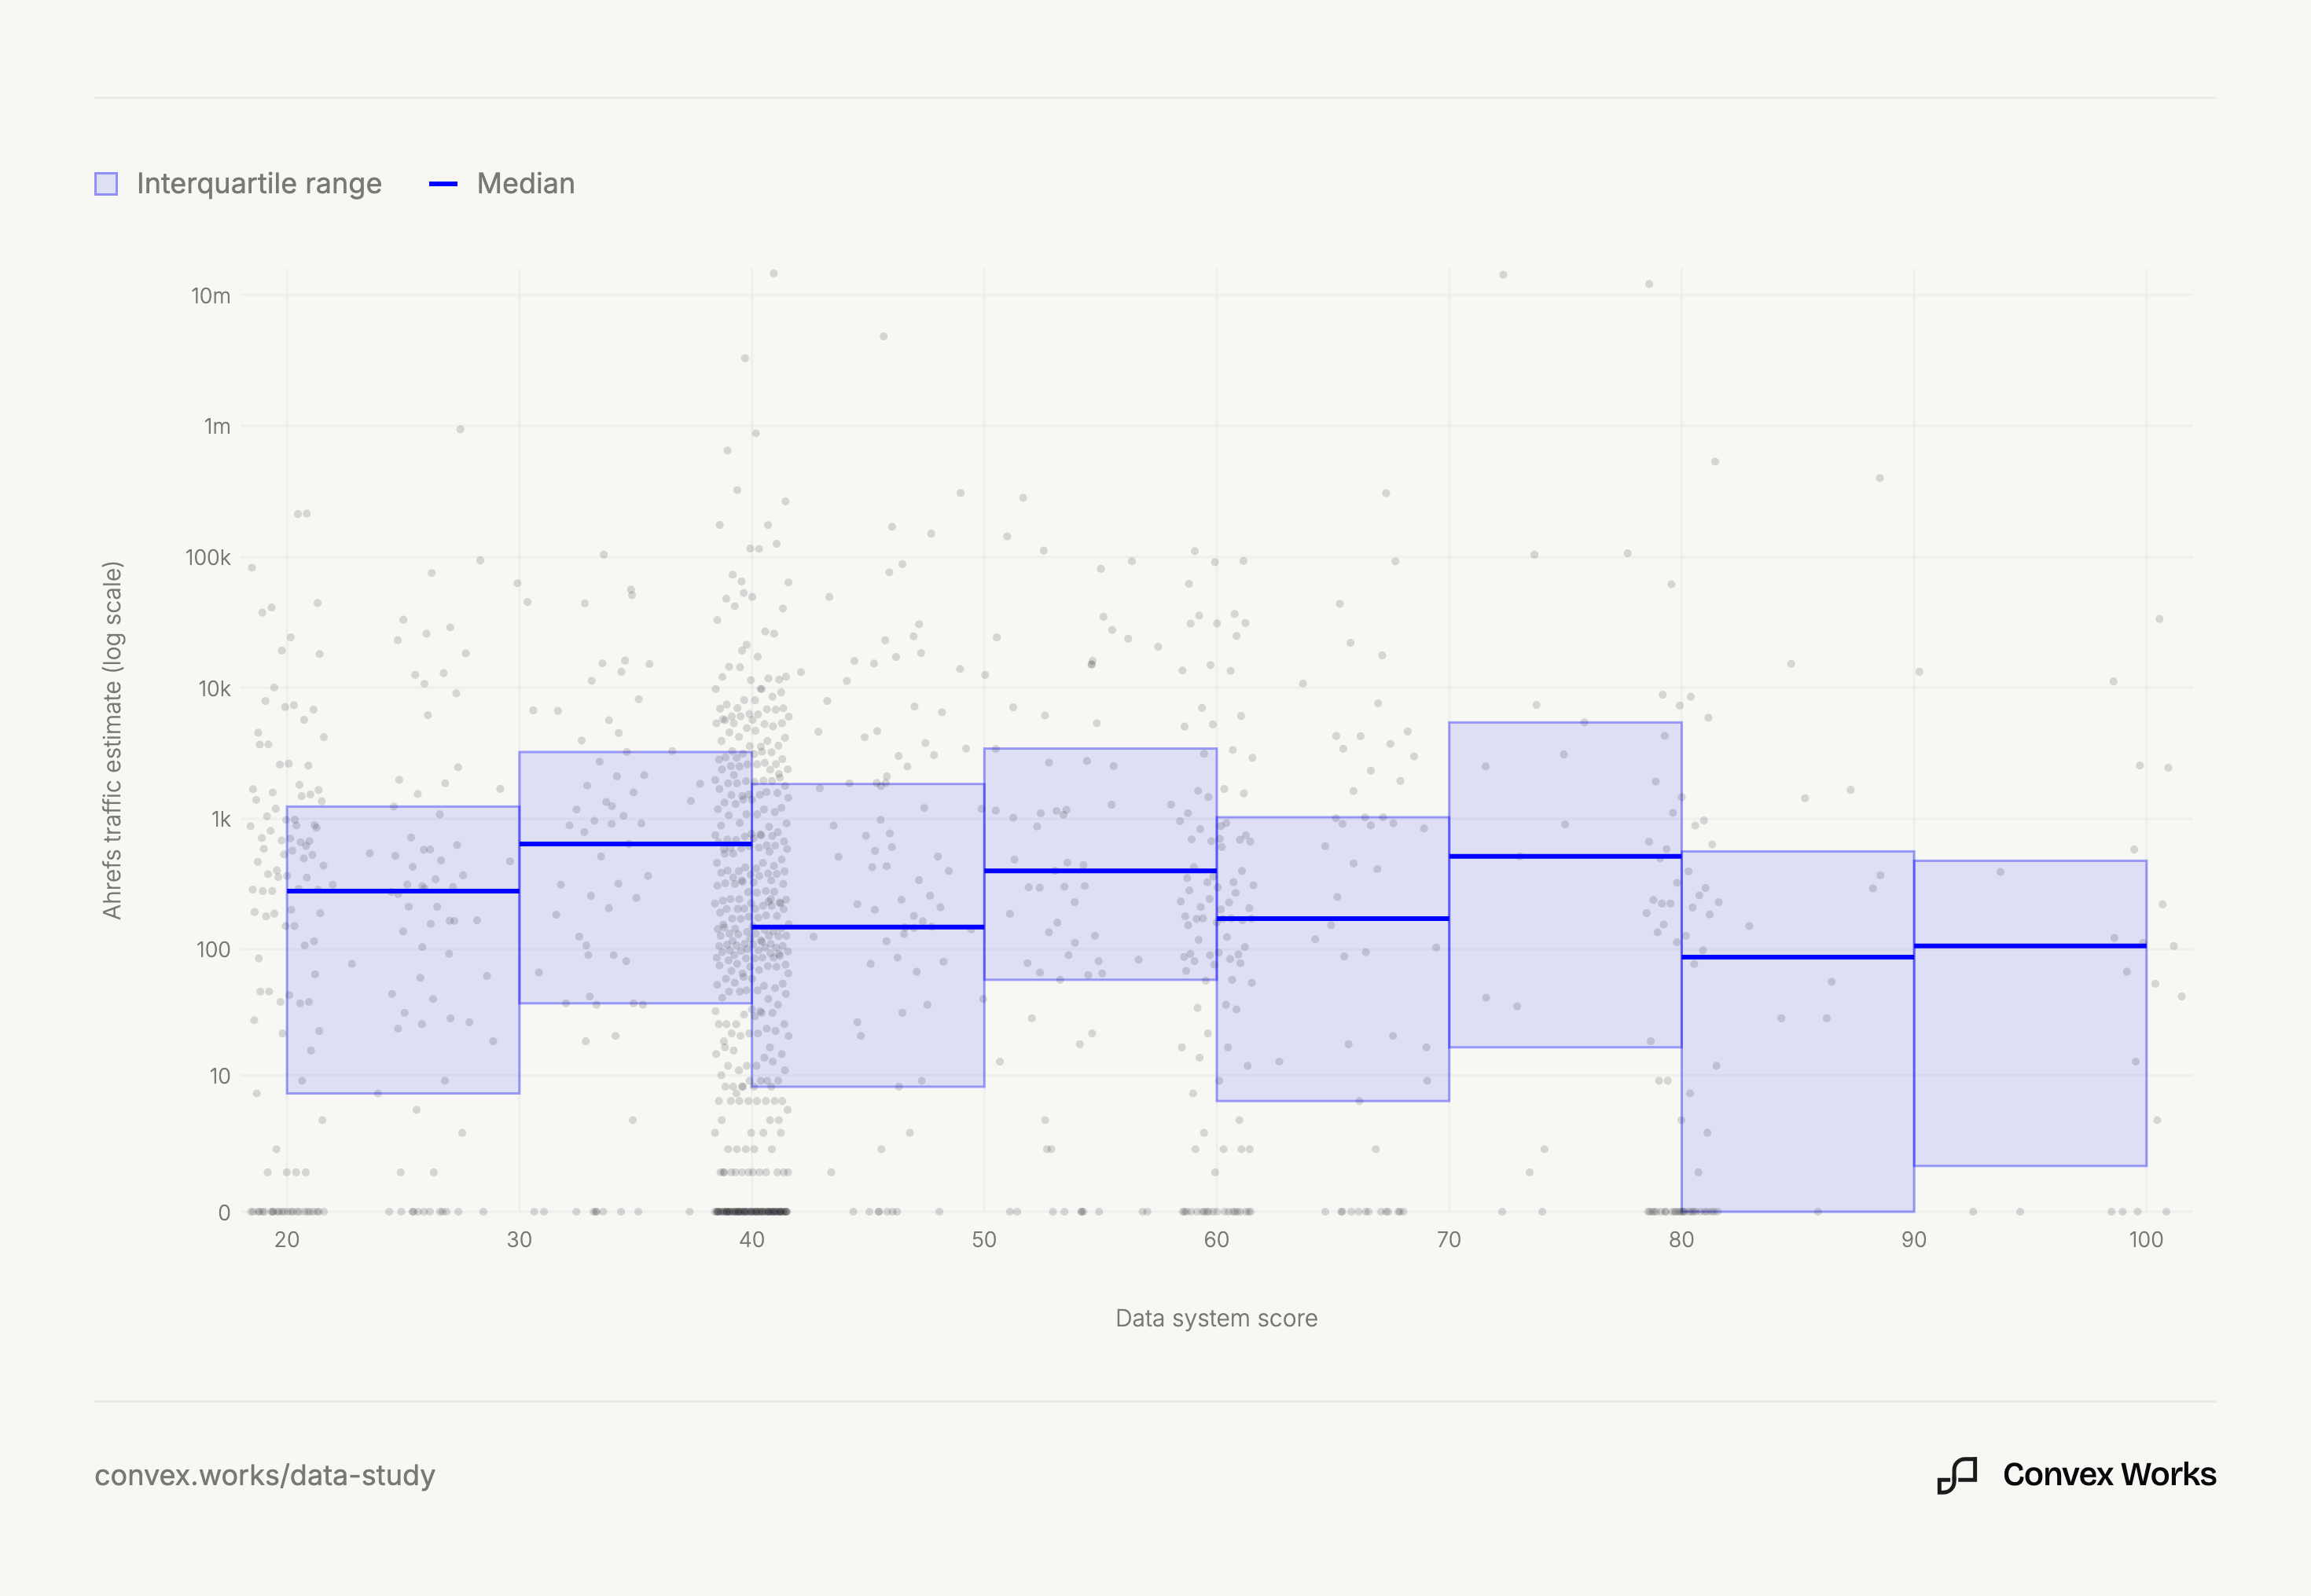
Points are horizontally jittered; DS scores themselves are discrete. The 1,116 sites produce 83 unique scores: 37.2% score exactly 40, and 80.6% occupy the ten most common scores.
Traffic is shown as log10(1 + estimated traffic), preserving all 211 zero-traffic sites. Spearman ρ = -0.026: higher-traffic sites do not appear to have better or worse DS scores. The published chart data contains only true DS score and rounded log-transformed traffic—no company names, domains, labels or hover data.
Cite this figure
This figure is published by Convex Works under a Creative Commons Attribution 4.0 licence. You may reuse it anywhere as long as you keep the attribution.
Plain text
Convex Works (2026). Data system score compared with estimated traffic. European software data study. https://convex.works/research/b2b-eu-data-systems/figures/data-system-score-traffic
BibTeX
@misc{convexworks2026datasystemscoretraffic,
  author       = {{Convex Works}},
  title        = {Data system score compared with estimated traffic},
  howpublished = {European software data study},
  year         = {2026},
  url          = {https://convex.works/research/b2b-eu-data-systems/figures/data-system-score-traffic}
}
Image file
Download PNG 980×676 at source scale